 |
| Fig. 1 (click to enlarge) |
I. Background
In this series I have intended to chronicle the development of software that makes attempts to project how the oceans of the globe will rise (SLR) in response to global warming (The Evolution of Models, 2, 3, 4, 5).
From a technical standpoint, I pointed out that the delay from initial emission of excessive CO2 into the environment, until the temperature rises in response to that excess, is the first phase of the exercise.
II. Wrestling With Lags and Delays
I went on to point out that there are two added hoops to jump through when carrying out the duties of an SLR software architect.
Those two hoops are the second and third delays.
The second delay is the lag between the initial temperature rise, until it has increased enough to cause ice sheets, ice caps, glaciers, and the like, to begin to melt (Ice Caps, Ice Sheets, and Ice Shelves: What's the Difference?).
The third delay problem is the fact that there are zones in the relevant locations (Antarctica, Greenland, and Non-polar areas) where the temperature rise will impact the ice sequentially.
That is, coastal areas will melt first.
Next will be lower altitude inland ice.
After that, more elevated areas with ice will see melt.
And so on.
The software solution was to deal with SLR in that sequential fashion, because simulating reality is going to be supported by the ability to observe and collect real data (e.g. see "II. Don't Zone Out"here).
III. Educated Guesses and/or Projections
The exercise of educated guessing, a widespread practice among professionals and laypeople alike, cannot be escaped when dealing with the future.
The secret to better results is better practices, while the secret to best results is utilizing best practices.
In fact, one of the fundamentals of the scientific method is to predict something in a hypothesis.
If that hypothetical something "comes true" or "pans out" the hypothesis can move on and be called a theory (in good nomenclature two words can not mean the same thing - e.g Good Nomenclature: A Matter of Life and Death).
IV. The Useful Data
A. IPCC Data
I chose to use IPCC data that had made hypothetical projections about future CO2 and temperature levels that proved true years later (now 4.25 deg. C by 2100 and avg. 750 ppm CO2 by 2100).
I chose not to use IPCC SLR data that did not pan out, but rather habitually underestimated SLR because they used a linear increase hypothesis.
With that data one can visualize a basic progression that will be taking place out to 2100 and beyond.
B. SLR Data
The inaccuracy of the IPCC SLR data meant taking a look at another report source, which ended up being the Potsdam Institute (cf. PNAS), as mentioned in the second post of this series.
The main data point is their calculation of 2.3 m of SLR per 1 deg. C of temperature rise.
Putting that and the IPCC projection of 4.25 deg. C temperature increase by 2100, and the following emerged:
4.25 deg. C x 2.3 m = 9.775 mWhich leads to the next issue, which was not solved by the Potsdam Institute's report.
9.775 x 3.280839895 (ft. per m) = 32.1 ft.
32.1 ÷ 85 (yrs. to 2100) = 0.37647059 ft. of SLR per year
C. Lag / Delay Data
That issue is "when does the 32.1 feet of SLR manifest?" which is a function of delay
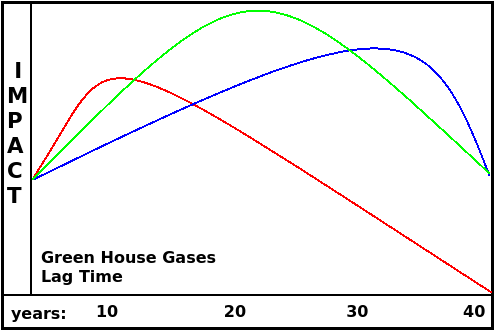 |
| Fig. 2Hypothetical Types of lag: early, uniform, late |
I begin with the quickest manifestation, which is 32.1 ft. of SLR by 2100.
Which means 0.37647059 ft. of SLR per year, since 85 years is the time frame of the 4.25 deg. C temperature rise.
Next, I look at a recent paper which challenged the traditional 40 yr. lag or delay between emissions of green house gases (GHG) and noticeable impact on the climate system (e.g. Fig. 2).
This was discussed in the Dredd Blog post Time Keeps on Slippin' Slippin' Slippin' In From The Past.
V. Putting It All Together In A Software Program
I mentioned in an earlier post that some climate system software has to have millions of lines of code.
That is not so for SLR software, because the problem is far less complicated, with far fewer moving parts, in terms of lines of code and degree of difficulty.
The things that matter are orders of magnitude less difficult than all the issues which full-on climate-system software has to deal with.
The main issues with SLR software are: 1) how much CO2, 2) will generate how much average global temperature increase, 3) over what span of time, 4) with how much delay / lag between each significant event, and 5) when will all that cause ice melt to take place in Antarctica, Greenland, and Non-Polar global locations.
The graph at Fig. 1 is a result of manifestation of the datasets derived from the scientific papers mentioned above.
And their now-having-been-incorporated into software.
Software that projects the results of that data out into the future.
VI. What Is The Most Important SLR Issue To Resolve?
This was discussed in another Dredd Blog post:
1) knowing the SLR potential(The Agnotology of Sea Level Rise Via Ice Melt). In the previous post we took seriously the report of some scientists and public works department people from California who did not mince words:
2) knowing key active melt zones
3) focusing on acceleration of melt
4) knowing how much SLR is catastrophic
The reason for focusing only on SLR software in a simplified way is underscored by 1 study in 1 city in 1 country, out of 196 countries with more than 4,764 ports (World Port Source):(The Evolution of Models - 5). Writing software that makes the hair stand up on the back of one's neck is not difficult.2.4 Resources Threatened by Sea Level Rise(Impact of SLR - San Francisco Bay, emphasis added; PDF). The real difficulty is not "being able to see" what is coming (it is easy to see what is coming).
In any given area, rising seas pose a threat to many different types of resources. Among the vulnerable coastal systems are transportation facilities such as roadways, airports, bridges, and mass transit systems; electric utility systems and power plants; stormwater systems and wastewater treatment plants and outfalls; groundwater aquifers; wetlands and fisheries; and many other human and natural systems from homes to schools, hospitals, and industry. Any impacts on resources within the affected area may lead to secondary impacts elsewhere.
...
3,2 ... Facilities At Risk [@ 1 m/3 ft. SLR]
Schools ... 60 ... Healthcare facilities ... 29 ... Fire stations ... 10 ... Police stations ... 8 ... hazardous material sites ... 208 ... buildings ... 49,000 ... lives ... 220,000
3.4.2 Ports
...
Our assessment of future flood risk with sea level rise shows significant flooding is possible at the Port of Oakland. The San Francisco and Oakland airports are also vulnerable to flooding with sea level rise. In addition to directly affecting port operations, sea level rise may cause other interruptions to goods movement at ports. Sea level rise can reduce bridge clearance, thereby reducing the size of ships able to pass or restricting their movements to times of low tide. Higher seas may cause ships to sit higher in the water, possibly resulting in less efficient port operations (National Research Council 1987). These impacts are highly site specific, and somewhat speculative, requiring detailed local study. We also note the connection between possible direct impacts of sea level rise on the ports themselves and possible flooding of transportation (rail and road) corridors to and from the ports.
...
4.1 Conclusions
Rising sea levels will be among the most significant impacts of climate change ...
We estimate that sea level rise will put 220,000 [people at risk] ... with a 1.0 m ... rise in sea levels ... A wide range of critical infrastructure, such as roads, hospitals, schools, emergency facilities, wastewater treatment plants, power plants, and wetlands is also vulnerable. In addition ... property is at risk ... with a 1.0 ... m rise in sea levels ...
(TEST: multiply the individuals in that 1 area who must move, by the number of ports ... 220,000 × 4,764 = 1,048,080,000 ... if moving over a billion people does not convince us, then multiply each of those figures, for each item, schools, healthcare facilities, fire stations, police stations, hazardous material sites, and buildings, etc., by 4,764).
The real difficulty is being able to do something about the impact of SLR.
Dealing with what is causing the rapidly approaching catastrophe is the real difficulty.
VII. Conclusion
The 3ft. / 1 meter SLR is coming much faster than previous SLR software, in its erroneous linear projections, has contemplated.
Lag is the reason the graph in Fig. 1 does not reach the 32.1 ft. level, because lag and delay put about half of it past the year 2100.
Nevertheless, the 3ft./1m. catastrophe level is the crucial factor to keep in mind.
Many more people will be driven insane during those episodes.
More governments will faint and panic too.
Nevertheless, grass roots people can hopefully extend their lives, the lives of their children, and the lives of their fellow citizens by "going local."
Local power generation, local food production, local industries, and local social endeavors of all sorts are good ideas to live by and implement.
Not because of selfishness, isolationism, or any of those types of social dynamics.
But, rather, because the international civilization is going to be torn asunder by its own folly.
It's grave mistake was to get a blood transfusion from renewable resources to fossil fuels.
Fossil fuels are the death knell of civilization as we know it (Civilization Is Now On Suicide Watch, 2, 3, 4, 5, 6, 7, 8).
And our civilization is addicted to fossil fuels.