 |
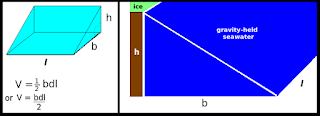
| Fig. 1 Basic formula @ Math Teacher adapted |
Using the prism shape, I calculated the cubic kilometers of sea water held by ice sheet gravity around Greenland and Antarctica.
The volume values were not taken further to determine how much sea level rise (SLR) would take place.
So, in today's post I will do that calculation while using a simpler, more direct formula by replacing the conceptual shape from a prism to a wedge (Fig. 1).
The simple formula then becomes V = bhl / 2, where "b" is the distance from the coastline to the "hinge point" (The Evolution and Migration of Sea Level Hinge Points); "h" is the depth of the sea level fall (SLF) to be released by ice mass / gravity loss, and "l" is the length of the coastline.
Using the figures from the previous post, first we begin with the 1m global mean average SLR problem:
the unequal raw numbers are:The next thing to do is figure out how much SLR is generated by this seawater once it is relocated (Climate Sanity):
b = 2000 km
h = 20 m
l = 44,087 km (Greenland coastline length)
l = 17,968 km (Antarctica coastline length)
(see Wikipedia for those coastline lengths)
converting all figures to meters, the preliminary figures are:
b = 2000 km * 1000 = 2,000,000 m
l = 44,087 km * 1000 = 44,087,000 m (Greenland)
l = 17,968 km * 1000 = 17,968,000 m (Antarctica)
l = 62,055,000 m (length of both coastlines)
Those figures fit the formula as follows:
V = (b * h * l) / 2
V = (2,000,000 m * 20 m * 62,055,000 m) / 2
V = (2.4822×10¹⁵ m3) / 2 (meters)
V = (2.4822×10¹² km3) / 2 (kilometers)
V = 1.2411×10¹² km3
2.78 x 10⁻⁶ m = 0.00000278 m (1 km3 = 2.78 x 10⁻⁶ m of SLR)This is 11.32 feet of gravity induced SLR added onto the 1 meter of SLR generated from the ice sheet melt water of Greenland, and the 1 meter of SLR (2 m total) from equal Antarctica melt water.
(for mm << m we divide by 1000, to derive 0.00000000278 mm)
1.2411 × 10¹² km3× 0.00000000278 mm = 3,450.258 mm
3,450.258 mm = 11.32 ft. (divide mm by 304.8 to get ft.)
Let's recap: Professor Mitrovica calculated that a 20 meter drop in sea level (SLF) around Greenland, extending out 2,000 km to the "hinge line," would take place if enough Greenland ice sheet melted to raise the global mean average sea level by 1 meter (I added another meter --from Antarctica -- so 2 m total).
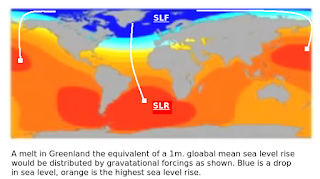 |
| Fig. 2 Blue area relocated to Orange area |
Thus, in addition to the 2 m (6.56 ft.) from the ice melt, there is an additional 11.32 feet of SLR (don't forget the 20 m of SLF @ Greenland and Antarctica).
The additional seawater distribution is not associated with direct ice melt (it is already seawater), but is due to gravitational power lost when the ice sheet on land melts and loses mass (& loses gravity power).
That 1.2411×10¹² km3 of gravity-held water is released from the coastal areas, and is then relocated to various spots around the global ocean (Fig. 2).
This happens according to the Earth's rotational, gravitational, etc., forces acting upon that released seawater (adding an additional 11.32 ft of SLR in places).
Can you see that I had a valid reason for hypothesizing that this "ghost water" is probably missing from consideration in the traditional SLC software models (The Evolution of Models - 19) which have repeatedly underestimated SLR?
I have mentioned that I also think it is a reason that words like "El Nino, King 'Tides', coastal 'flooding', etc." are conjured up by some influential meteorologists (they are missing some obvious factors).
Maybe next time we will take a look at the impact a 100 m SLF (Professor Mitrovica) around Greenland and Antarctica would have.
The previous post in this series is here.